
Primer on Linear Regression in Python
Regression is at the root of almost everything in quantitative finance as well as data science. So it’s good to go into a little more…

Primer on Linear Regression in Python
Regression is at the root of almost everything in quantitative finance as well as data science. So it’s good to go into a little more detail that here. As usual, all the code is available at the notebook here.
To understand linear regression, we actually have to first understand what is correlation and covariance.
These two measures are very similar — the key difference is that correlation deals with variables that have been standardised, but co-variance does not (and so is affected by the scale of variables that you are working with).
What do we mean by standardisation?
To standardise or normalise a measure, you simply compute the mean and standard deviation of the the series, and then do this to each of the elements in the series/array so that they are at a similar scale.
The notebook shows how we can manually compute correlation and covariance, and what it means to normalise something.
Linear Regression
With that in mind, it’s fairly easy to understand how we linearly regress something.
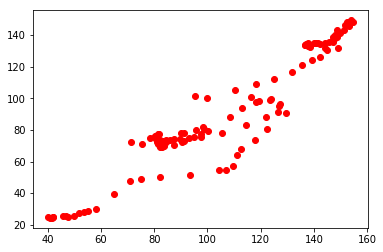
To put it very simply (and keep the mathematical concepts to the notebook here), we sometimes want to find the relationship between two things. Say, we want to see how a move in the property price index (PPI) (i.e. all properties, new or resale) would affect the resale property index (Resale Index). We can treat the PPI as x (i.e. the independent variable), and the Resale Index as the y (i.e. the dependent variable). To find the relationship, we need to work out a line with the equation y = mx +c
To do this we have to find one that is a good fit to the existing datapoint, and we do this by finding a fit that minimises the sum of squared differences between the line and the data points. And the correlation which we went through earlier is simple what we use to measure the goodness of the fit.
Now for an example.
As usual, we import the libraries and all the data that we need from CSV files.
import statsmodels.api as sm
import statsmodels.formula.api as smf
import pandas as pd
resale = pd.read_csv('resale.csv')
ppi = pd.read_csv('ppi.csv')Do some data munging.
merged = pd.merge(ppi, resale, on='quarter')
merged = merged.drop(['level_1'], axis=1)
merged.columns = ['Quarter', 'Resale Index', 'PPI']
If we plot the two indices, the relationship will be pretty obvious.
Now we use statsmodels’ OLS function to do the linear regression.
linear_regression = sm.OLS(y,X)
fitted = linear_regression.fit()
We can see the stats with …
fitted.summary()It’s a long list of results, but I’ve tried to explain each of them in the notebook.
And that’s it.
The notebook also goes through alternative methods of regression, and also how we can apply them in finance (specifically for finding betas of stocks).
The full set of code is in the notebook here.
playgrd.com || facebook.com/playgrdstar || instagram.com/playgrdstar/