
Thinking in AI | Focusing on Data Types
Thinking in AI is really about understanding data types and tasks

Hopefully, we now understand the basic premise for thinking in AI, and have an intuitive understanding of how an AI model works. Now let’s move on to the core of this series - data types and tasks.
When you have a problem that needs solving, and assuming it is not in your area of expertise, how do you determine who to seek help from? You would usually make the decision based on the person’s background and expertise, which requires you to have a basic understanding of their capabilities. Thinking in AI follows the same logic.
There are a wide range of AI techniques and methods that we can employ. Prior to the emergence of Generative AI, most of these AI techniques, whether machine or deep learning, were specialized.
I would argue that even with the emergence of Generative AI, which we usually view as having more generalized capabilities, they are still better treated as specialized tools for a specific range of tasks.
The main idea that we are going to cover when trying to understand data types and tasks is a simple one: the kind of data you have shapes the AI tasks you can realistically undertake. Together, these two aspects will shape the AI technique or techniques that you can use to solve your problem.
This helps us to move away from seeing AI as one big, monolithic black box and gives us a practical way to think about applying AI to our problem effectively. It drives the way we process data, the models we use, the system we build around the model, how we evaluate its performance, and even how we explain the model outputs. It helps us avoid a mismatch of expectations, or misunderstand what the AI is doing.
Now, in this article, let’s focus on understanding the types of data we have to deal with when trying to solve problems with AI in the real world.
Once again, as mentioned in the prior article, most of the concepts in this series are not new, especially to AI researchers or practitioners, but I hope sharing the way I think about them might be useful to readers who are not as familiar with AI.
Data Types
The phrase ‘rubbish in, rubbish out’ is often used to refer to the impact that data quality has on AI. This has been discussed to death. We also commonly talk about whether data is numerical, categorical, ordinal and so on. Again this is fairly common knowledge. We will not cover these aspects relating to data here as there are already many articles on these topics.
In this article, I will instead focus on another aspect of data that is less discussed - the underlying nature of data.
Let’s start off by thinking about the grid that artists or photographers use.

Why do I bring up the grid? Well, for most AI models, the data that they finally use has to be 1) numerical and is 2) usually arranged in a grid-like manner.
What is this grid? We can call it a matrix, or even a tensor. For most folks who have worked with AI models (i.e., really worked with AI models, and not just entered a prompt), the regular array (2 dimensional or even a multi-dimensional one) should be quite familiar.
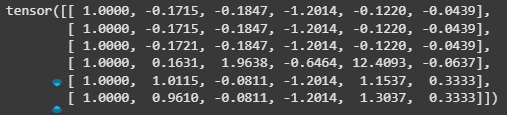
The first point on the final data being numerical should be quite intuitive now that you understand the underlying mechanics of AI models from the prior note on “Deconstructing AI: An AI Model is Just Math”. Afterall, the only way math can work is with numbers.
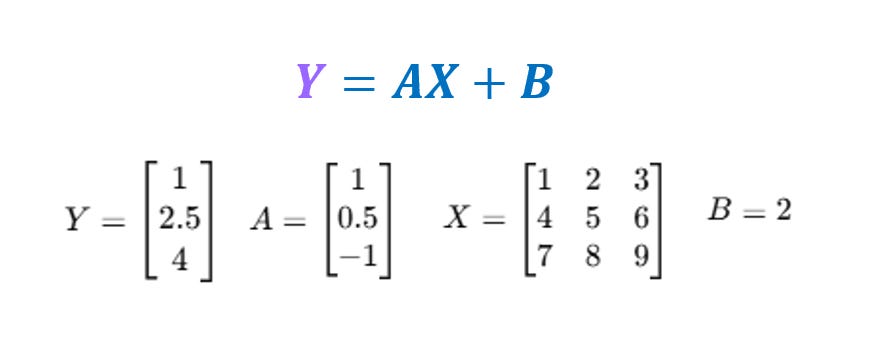
The second point on the grid is a little more complicated, as it relates to how we do operations (say addition, subtraction, multiplication) in the AI model. We can again use a linear regression to understand this, when we go beyond one dimension, we start seeing grids.
We won’t delve too deeply into this.
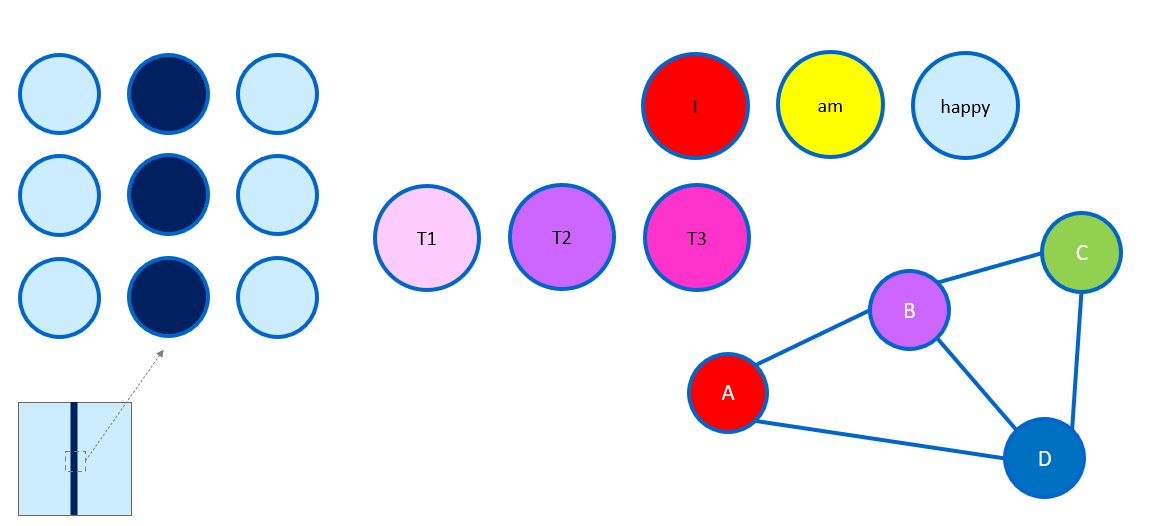
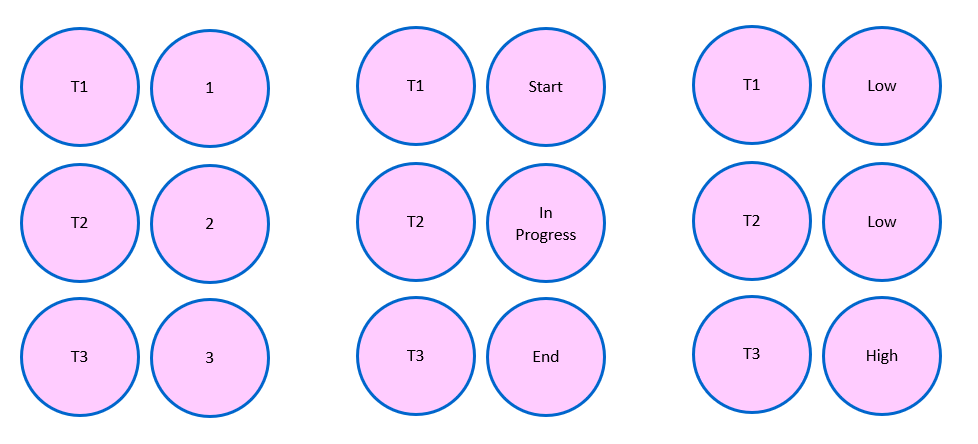
For now, just remember this requirement, and think about how we can translate data into such a format that is suitable for the AI model. Think about a table that is filled with numbers in Excel. We already intuitively understand this. But there are some nuances for such tabular data. Sometimes we may not just have numerical data, but binary (Yes/No) or categorical (Low, Medium, High). We can simply convert this into numbers (see Col. 2 and Col. 4_1 and Col. 4_2).
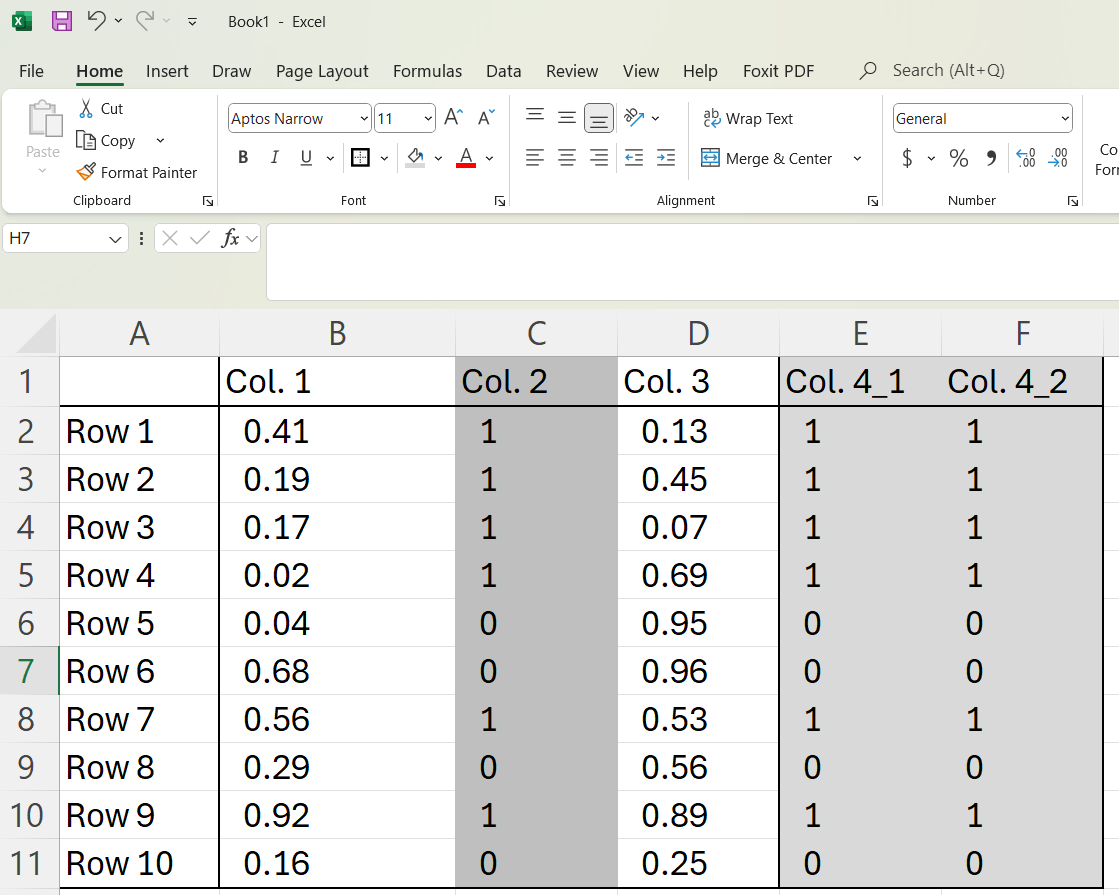
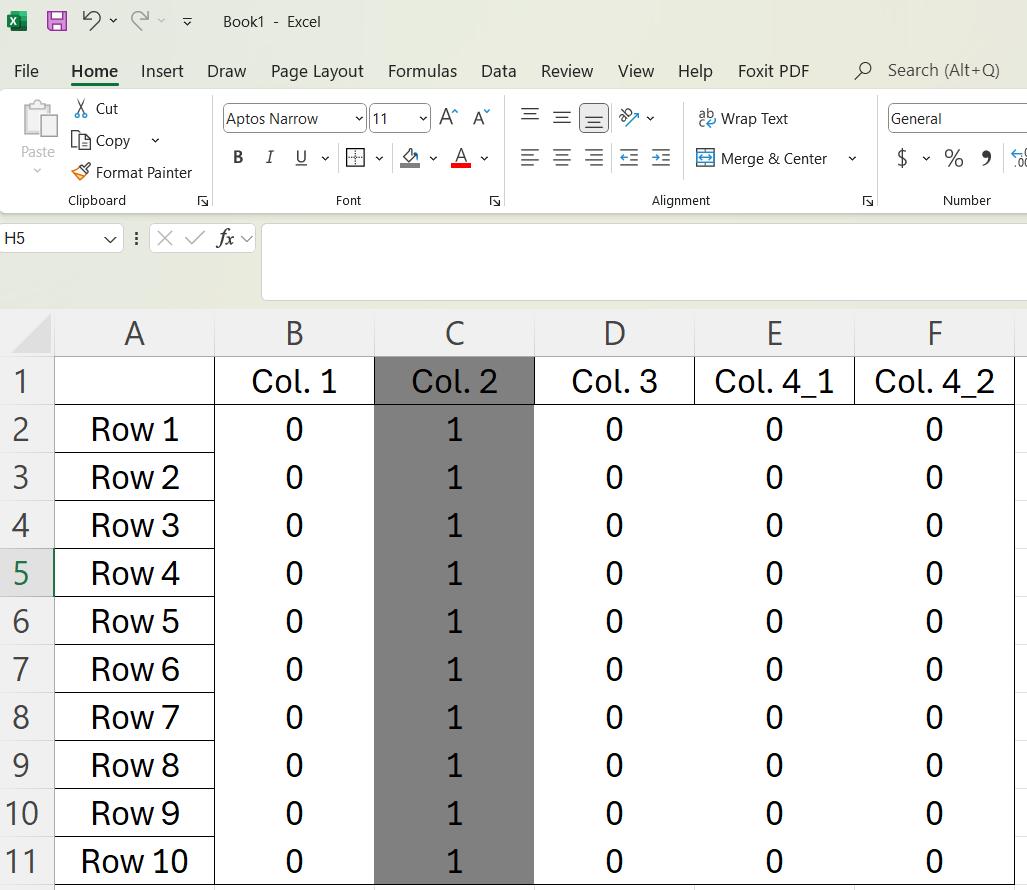
Now you may think that this is really trivial. But we can easily also represent this as an image. Col. 2 in the spreadsheet below represents a line.
Now that we have established this understanding, one may then wonder why we cannot just use the same AI model for all data types, and why do we even bother with the concept of multimodality (which relates to problems where we have to use AI models for data of different types or modalities).
This leads us to consider the distinct inherent structures and characteristics of different data types.
Follow on to find out more.
Diving into the different data types
The first broad distinction we can make is between structured and unstructured data. Without going into academic details, we can generally treat data in tables as structured (including time series data, which can be seen as tabular data with time-stamps), and most other data as either unstructured or semi-structured in nature.
Examples of clearly unstructured data are text or images, while examples of data that do not cleanly fall within either structured or unstructured are networks or graphs.
There are many shades of gray though, since one could also have unstructured data embedded in tables, or find a great deal of structure in certain types of images, e.g., scans of invoices or screenshots of user interfaces.
In general, we will probably find it easier to think of structured data using the mental model of the grid we went through earlier. But unstructured data would usually require a bit more effort to fit it within this grid.
Now let’s get a quick overview of some basic data types:
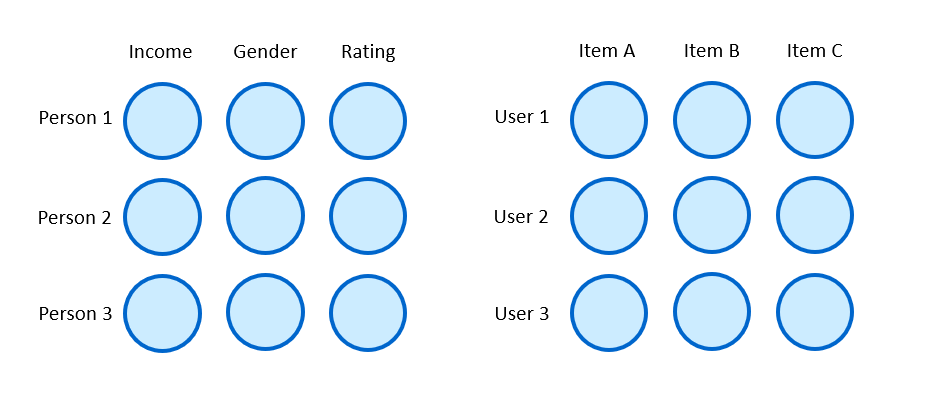
Tabular: Your classic spreadsheet or database tables. Rows are records (like customers), columns are features (like name, age, purchase amount). Highly organized. Examples include customer records, financial data.
Time series: A sequence of data points over time. Examples include daily stock prices, hourly website traffic, monthly sales.
Text: Written or spoken language. Examples include emails, reviews, articles, social media posts, contracts.
Image: Visuals like photos. Examples include artwork, online images, X-rays, satellite images.
Networks or graphs: Relationships (edges) between entities (nodes). Examples include social networks, transaction linkages.
Again, there are many other data types, and some of these could be viewed as combinations of the data types above.
For example, a sequence of images, combined with the spoken language, would give us videos. Product listings on Amazon combine text descriptions and images. Financial news reports may include text, tables, images and videos. Even a mobile application’s user interface can be viewed through this lens - a user interface is effectively a network of different elements (buttons, text fields, images) linked together, each potentially associated with text labels and visual properties.
They are not the same
So, why the focus on data types? Again the simple reason is because different data types have different underlying characteristics. These differences influence the AI techniques used for them. This is still true even in the age of Generative AI models. Let’s try to understand some of the most common data types quickly, without getting into too many academic details.
Tabular Data
This is probably what most people working with data are most familiar with. Tabular data is highly structured, consisting of rows (representing individual records or instances) and columns (representing specific features or attributes). The fundamental units of tabular data are the values in each cell in the table.
More often than not, the data in tables are highly diverse, and can be numbers, categories, or even ordinal (e.g., high, medium, low). Each of these types of columns require specific preprocessing steps before AI models can use them.
AI models analyze patterns both within and across rows to predict specific outcomes, cluster similar records together, or detect outliers. Individual features usually have clear real-world meanings, and their importance can usually be measured, making it easier to explain what drives model outputs.
Machine learning models are commonly used here, like gradient boosting models (e.g., XGBoost, LightGBM) which focus on learning complex interactions between these features and mapping them to outputs. Deep learning models have been developed for tabular data but are still usually not the first models that practitioners reach out for, due to the greater complexity and the competitive performance of machine learning models even when compared to these deep learning models. Such deep learning models also require significantly more tabular data, and are less explainable.
The characteristics of tabular data can vary significantly depending on the domain (e.g., credit loan records vs. sales records). Hence, unlike some of the data types we will describe later, it is still hard to develop foundational models akin to LLMs that can be used as generalized models across different domains and tasks.
Text Data
This is probably what almost everyone is most familiar with. Prior to the advent of Generative AI models, AI models in the domain of natural language processing were more specialized and less accessible. However, with the emergence of LLMs, text has become the de facto way in which almost everyone interacts with AI models.
Text data deals with written or spoken language, like emails, articles, or reviews. Its primary characteristic is its sequential nature – the order of words is crucial. The meaning of words also depends heavily on the context in which it appears. The fundamental units of text data are tokens, which are either whole words or parts of words. Transforming text into numerical representations requires significant preprocessing. Even with LLMs, the inherent ambiguity and nuance of language still presents significant challenges, and these need to be captured in their representations.
AI models need to capture both local patterns based on how nearby words influence meaning, as well as global patterns such as the overall topic across sentences or paragraphs.
AI models, particularly models like transformers (or say recurrent neural networks previously), focus on modeling these complex dependencies and contextual relationships across text to understand meaning, classify documents, answer questions, or generate new text.
The complexity and nuances of text, as well as the use of more complex AI models makes it harder to explain exactly which words or tokens led to the output generated by the AI model. Sometimes, the nature of the task makes explainability harder too, e.g., how do you explain how a summary was generated?
While characteristics of tabular data can vary significantly depending on the domain, the availability of extremely large text datasets (from the internet and across various data repositories) has made it possible to train foundational models such as LLMs that can be used as generalized tools. Deep learning models have largely supplanted machine learning models for text data. Among deep learning models, transformer models used in LLMs have also superseded many of the older models such as recurrent neural networks.
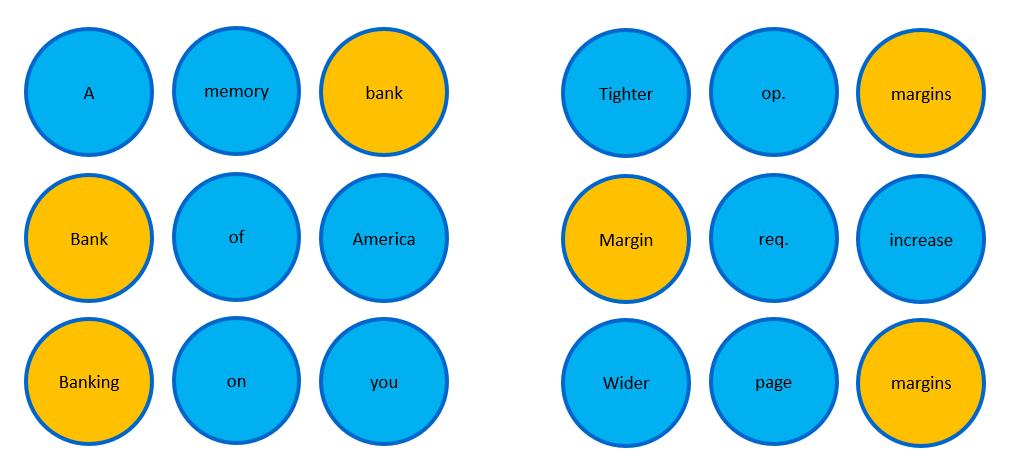
Image Data
Another type of data that many of us are familiar with. Even prior to the advent of Generative AI, deep learning AI models for images were already demonstrating the promise of deep learning, particularly for image recognition.
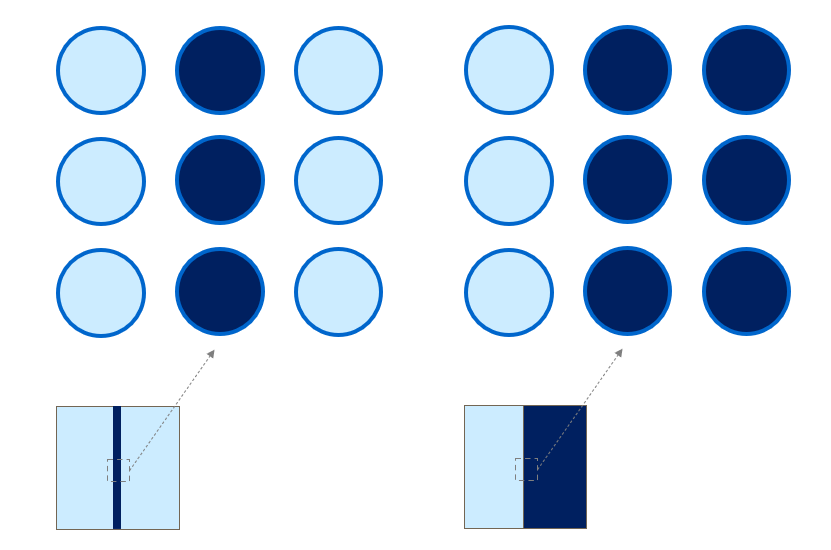
Image data represents visual information, such as photographs or medical scans. The fundamental units of text data are pixels, though we have also started focusing on image patches in some recent AI models. Its core characteristic lies in the spatial relationships between pixels, forming structures like edges, textures, and objects.
AI models learn patterns by analyzing these arrangements. Convolutional Neural Networks (CNNs), the dominant architecture for images, explicitly focus on exploiting this spatial hierarchy. Transformers are also increasingly used for image data.
AI models usually start by identifying simple local patterns and progressively combine these features through layers to recognize more complex shapes and eventually global patterns like complete objects and overall scenes. A practical need is often invariance, ensuring models recognize objects despite changes in scale, position, or lighting. Common tasks include image classification, object detection, segmentation, and generation.
Explainability for AI tasks on images can vary significantly. For image recognition tasks, it is fairly straightforward to explain which parts of an input image contributed to the AI model’s output. But for some other tasks, like image generation, this can be extremely challenging.
Similar to text data, the general availability of image data for training AI models, and the generalizable nature of image data has made it possible to train foundational models for tasks on image data, such as diffusion models.
Network (or Graph) Data
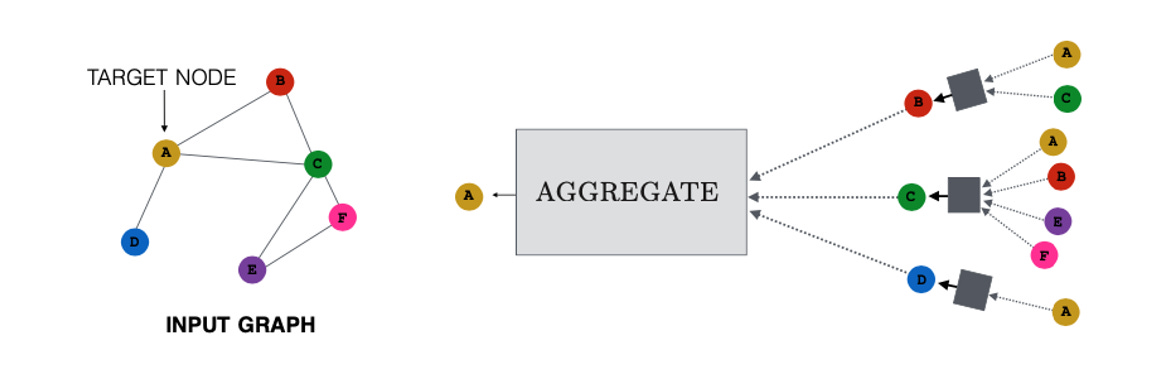
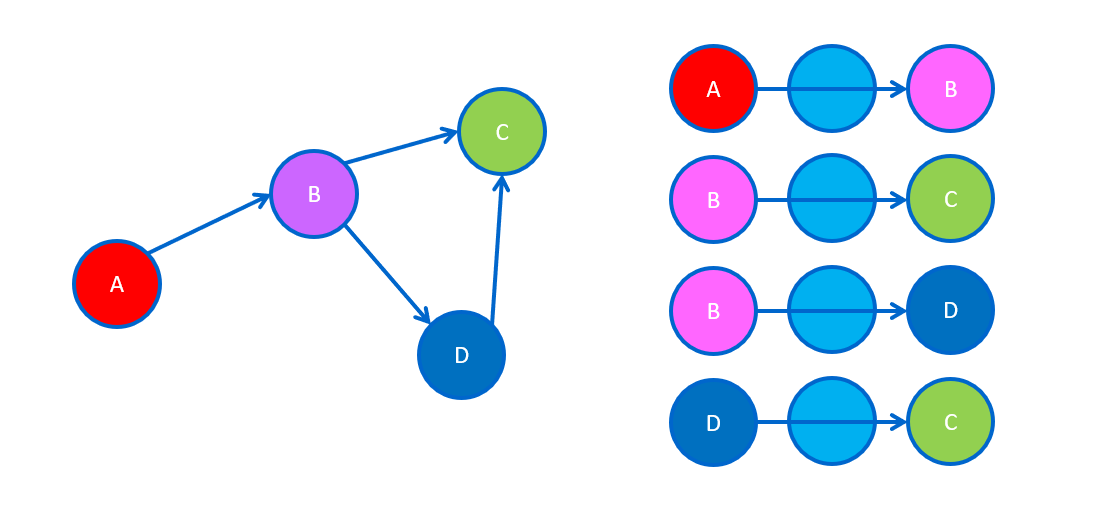
This is less commonly used (relative to the other data types), but very intuitively understood, no thanks to our familiarity with social media networks. Network or graph data represents entities as nodes (or vertices) and their relationships or connections as edges (or links), seen in social networks, molecular structures, or knowledge bases. The fundamental units are these nodes and edges.
Modern AI models learn from graph connectivity, analyzing both local patterns (a node's immediate neighborhood, connection types) and global patterns (a node's position within the broader network, community structures).
Analyzing such data posed challenges for earlier machine learning algorithms. Before the widespread adoption of deep learning on graphs, analysis often relied on rule-based methods or simpler methods that learned numerical representations before using these numerical representations in machine learning models.
Graph Neural Networks (GNNs) or variants (such as graph transformers) are now the favored deep learning approach for this data type. They typically operate via neighborhood aggregation or message passing, where nodes iteratively gather and combine information from their connected neighbors to update their own representations, capturing both local and broader structural context.
Common tasks include predicting missing links (link prediction), classifying nodes based on their connections and features (node classification), or identifying clusters of nodes (community detection).
Explainability for network or graph data tends to still be fairly difficult. If traditional machine learning and network analysis methods were used, it is not too difficult to understand how network statistics contributed to the output. But this may still not fully explain the role of specific network or graph structures. For deep learning on networks or graphs, explainability is a lot harder. We could use specialized techniques to hunt for the more influential network or graph structures, but understanding how they led to the AI model’s output is still challenging.
However, unlike text and image data where foundational models have become well-established, we are still some ways from general-purpose, pre-trained foundational models for networks or graphs. Key hurdles include the sheer diversity of graph structures and tasks across different domains (similar to tabular data) and the relative scarcity of large-scale, diverse graph datasets suitable for pre-training compared to text or image data.
Time series data is another important type of data, but I will just highlight a few key points on this to avoid making this note overly long.
The key difference between time series data and the data types above is the presence of time-stamps, and the need to capture patterns across time as well. The most common type of time series data is usually quite similar to tabular data, except that the table’s column includes time-stamps. But any of the data types above could be time series, e.g., networks or graphs that evolve across time.
Real-world problems rarely confine themselves to a single data type.
Multimodal data is common. For example, data from a shopping site would include product images, textual descriptions, reviews from different time periods and specifications in tables. Medical data may comprise patient history and lab results in text and tables, as well as medical images like X-rays or MRIs.
Working with multimodal data still needs to be viewed through the lens of the underlying data types, but it introduces new challenges, for example, how to identify relationships across different modalities or how to effectively combine or fuse data from different modalities. Nonetheless, even when faced with multimodal problems, the starting point should still be to first focus on understanding the characteristics and requirements of each underlying data type before considering how to combine them.
Key implications and conclusion
Understanding the underlying nature of different data types in AI is as important as data quality as these characteristics shape the way we process data, the models we use, the system we build around the model, how we evaluate its performance, and even how we explain the model outputs.
Even in this age of Generative AI models, such a lens is useful.
LLMs are trained on massive volumes of text data.
While there are concepts and data relating to time and networks or graphs in text, it does not mean that the LLM is the best AI model for graph tasks or forecasting.
Tables are abundant in the data that LLMs used for training, e.g., HTML tables, but it does not mean that LLMs are the best tool for extracting information from tabular data, particularly tables that have complex structures.
In the next article, we will use this understanding of data types to look at key AI tasks.