
A Guide to Network Tasks
Thinking in Networks

In the first note in this Thinking in Networks series, we saw that networks are everywhere. In the second note, we deconstructed networks into their core components: nodes, edges, and subgraph and graph structures.
The natural next question - what can we actually do with networks? This brings us to tasks with network data.
Most of us are familiar with different tasks with grid-like data like tables or images - detecting whether a transaction in a table is valid, or assigning an image to a category.
But what if the most valuable information or insights are not just in the individual transactions or instances, but in the relationships between them?
Tasks using network data require a shift in perspective because we now have additional information - the relationships between different entities, and because of such relationships, the ability to capture both local and global information. Capturing not just the local context of an individual entity but also its global role in a network changes what we can do.
For this note, let’s do a very quick tour through a broad range of network tasks and understand the questions that they can help answer.
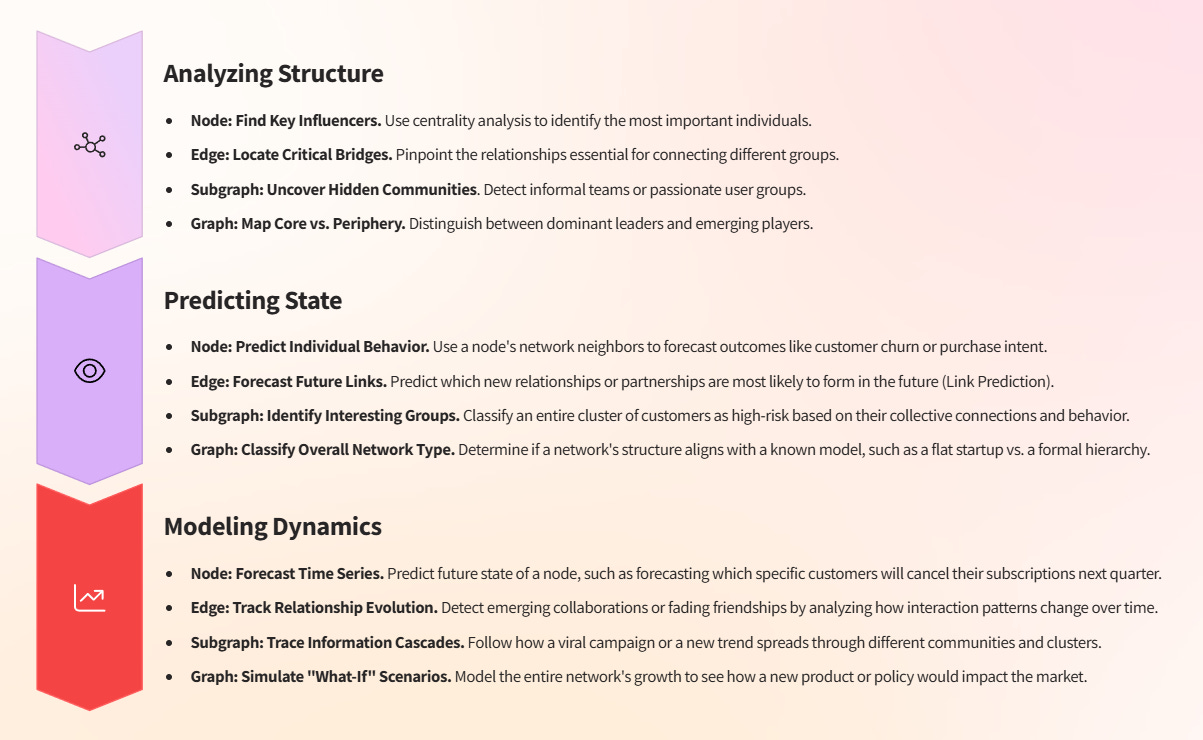
I will use my framework for thinking about potential network tasks - analyzing structure, predicting state and modelling dynamics to organize this note.
Within each area we will examine tasks that use different parts of the network - nodes, edges, subgraphs and the graph itself.
There are a wide range of tasks with networks but for this note we will just focus on a few key ones. Once one gets the gist of this, it becomes much easier to frame such problems.
Analyzing Structure of Networks
We first look at tasks related to just the topology of networks. Just understanding and analyzing a network's fundamental structure can already help with many tasks.
Node Level
Centrality Analysis (say degree, closeness, betweenness and eigenvector centrality as mentioned in the previous note): Identify the most influential node, e.g., a key opinion leader in a market whose endorsement is worth more than ten others combined.
Ego Network: Understand a node’s immediate neighborhood, e.g., mapping a key executive's direct and indirect reports to understand their sphere of influence.
Neighborhood Overlap: Measure the similarity between the connections of two different nodes, e.g., assessing the strategic fit between two companies by analyzing overlap in their customer bases or supply chains.
Edge Level
Edge Density: Measure the level of interconnectedness within a network, e.g., discovering a high-density community of users within a social network who are passionate about a specific niche to seed a viral marketing campaign.
Edge Betweenness: Identify the most critical relationships or connections that serve as key bridges for information flow in the network, e.g., identifying key relationships that are most critical to the stability of the entire financial system.
Subgraph Level
Motif Detection: Discover small, recurring structural patterns within the network, e.g., detecting "scatter-gather" pattern of financial fraud schemes.
Community Detection: Identify connected groups within the network, e.g., discovering the true informal structure of an organization by analyzing a company's internal email or Slack network.
Clique Finding: Identify subgroups where every member is directly connected to every other member, e.g., Identifying a group of companies where every entity has a significant cross-holding in every other entity in the group, representing a source of risk.
Bridge Detection: Find the critical nodes or edges that connect otherwise separate subgraphs, e.g., identifying that one angel investor who connects two distinct investment circles.
Graph Level
Core-Periphery: Identify a dense, highly interconnected core and a sparsely connected periphery, e.g., mapping a market to develop separate strategies for engaging with dominant industry leaders (the core) versus emerging players (the periphery).
Diameter: Measure the shortest path between nodes to understand the network's overall size and information diffusion, e.g., estimating how quickly information (or misinformation) can spread from one end of the organization to the other.
Predicting the State of Networks
We can also predict the state of nodes, edges, subgraphs, or graphs, for tasks that are very similar to what we have seen for other data types in the Thinking in AI series (classification, regression etc.). For such tasks, we leverage on the attributes or properties of individual entities or data points, as well as their relationships.
Node Level
Node Classification: Predict if a user will churn based on their network neighbors.
Node Regression: Predict how much a customer will spend based on the spending of their connections.
Node Attribute Imputation: Guess a user's missing demographic data based on the data of their friends.
Node Anomaly Detection: Flag a user account that suddenly makes hundreds of suspicious connections.
Edge Level
Link Prediction: Predict who will become friends or partners.
Edge Classification: Label a relationship as friendly or adversarial.
Edge Weight Prediction: Predict the volume of transactions between two companies.
Edge Anomaly Detection: Detect anomalous transfers between bank accounts.
Subgraph Level
Community Prediction: Predict the community membership of a new signup to a social media network.
Subgraph Classification: Identify a cluster of customers as being at high-risk of churn due to their membership in a part of the network.
Graph Level
Graph Classification: Determine if an internal messaging network behaves like a flat startup or a hierarchical organization.
Graph Regression: Estimate the potential revenue of an entire sales network.
Graph Similarity / Matching: Compare the collaboration networks of two different departments.
Modelling the Dynamics of Networks
Finally, we can model networks that evolve. This allows us to perform simulations - model how ideas spread, how systems evolve; as well as make predictions of future states. Almost all the tasks mentioned earlier can be applied here, but with the added dimension of time. We will just touch on a few interesting ones.
Node Level
Node Forecasting: Forecast which specific customers are likely to cancel their subscription.
Edge Level
Edge Formation: Detect fading friendships or emerging business collaborations over time.
Edge Weight Forecasting: Predict whether two partners will transact more or less with each other next year.
Subgraph Level
Community Evolution: Assess if a large customer segment will change after you launch a new feature.
Subgraph Emergence: Detect the formation of a new trend or interest group in real-time.
Cascade Tracking: Trace how viral marketing content flowed through different communities.
Graph Level
Graph Growth Modeling: Simulate how your user network may change due to the introduction of a product feature.
Diffusion Simulation: Run "what-if" scenarios to see how a new product would be received by the market.
One Final Dimension
All the tasks above can incorporate even richer data, including attributes of different modalities (text, image, numerical) and positional information that describes a node's role. This was essentially the focus of my research on dynamic multimodal networks (see my dissertation here).
Generative AI on Networks
Generative AI with networks brings about even more possibilities. Two examples.
GraphRAG
You've heard of Retrieval-Augmented Generation (RAG). But standard RAG often retrieves isolated sentences, missing the forest for the trees.
GraphRAG first builds a knowledge graph from your data. When you ask a question, it doesn't just retrieve facts; it retrieves an entire subgraph or community, which is usually a richer cluster of interconnected concepts. This can help with more insightful and reliable answers for complex questions.
Generating New Networks
Being able to generate or predict entirely new, complex network structures can be really useful. Deepmind’s AlphaFold is a key example. For years, predicting a protein's structure from its amino acid sequence was a key challenge. AlphaFold leverages both Generative AI and network structures to help with this task. It treats the sequence of amino acids as a graph, where each acid is a node and the relationships between them are edges. AlphaFold reasons about these connections to predict protein structures.
And finally…
Thinking in Networks pushes you to not just look at individual entities or objects but also their relationships, flows and hidden structures. It enables a shift in our mindset for solving problems.
I hope you found this series of notes on Thinking in Networks somewhat useful.