
3 Days of Hand Coding Visualisations — Introduction
[Post is also available at quaintitative.com]

3 Days of Hand Coding Visualisations — Introduction
[Post is also available at quaintitative.com]
I have been doing a simple beginner’s course on hand coding visualisations at work.
A wide range of tools are available for visualising data, from the ubiquitous Excel to the very user friendly (but not cheap) Tableau.
But I thought it would still be useful to do a short course on how to hand code visualisations, and the range of ways in which to do that. There are a number of advantages in choosing the hand coding route.
It’s free. Even Excel costs $, not to mention Tableau, where the costs can run into the thousands.
It’s flexible. You are not limited to the chart types that Excel or Tableau offers. Almost anything you can imagine can be coded, and interactions built in.
It’s easy to show off your creations. Anyone with a web browser will be able to view and interact with your data visualisation.
The original course is about 1.5 days long.
I shall split it into 3 parts, that even someone with very little coding knowledge could cover in 3 days.
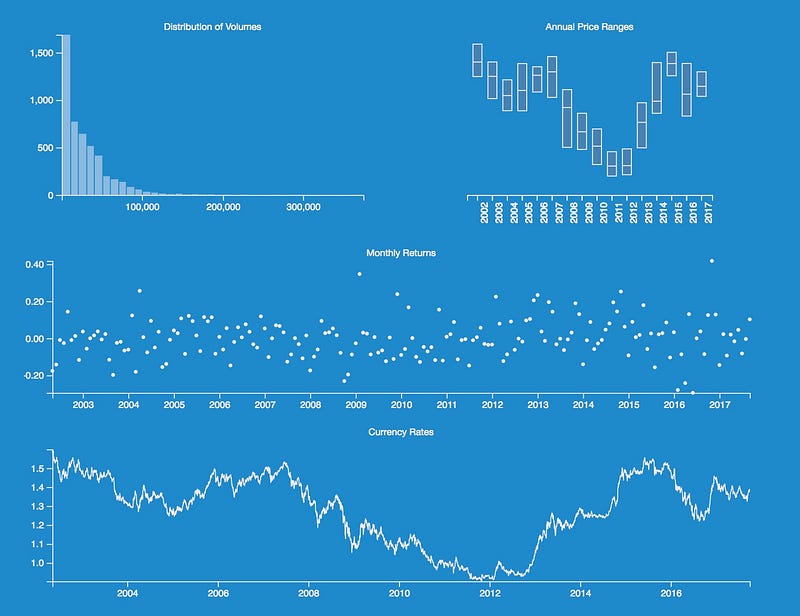
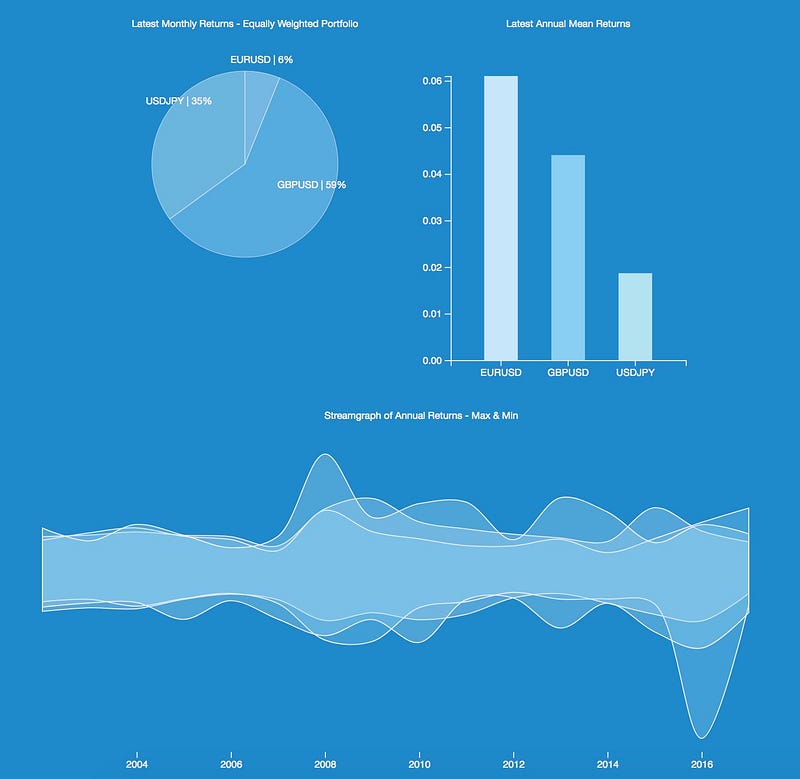
At the end, you would hopefully have gained a good knowledge on the range of tools available for hand coding visualisations, and be able to create the visualisation shown below, which can be accessed at this link.
playgrd.com || facebook.com/playgrdstar || instagram.com/playgrdstar/